
Through the “Monitor” module, you can monitor the client's network, CPU, memory, disk, and other performance information after the client computers are controlled. And you can also set up alerts to provide timely warning of abnormal performance information and analyze its abnormal conditions. There are 5 tabs available to check different kinds of information monitored on all controlled client machines.
You can directly click the "Monitor" tab to use the feature.

Status Overview
The status overview page includes statistics: online device, online device network speed, and alert.
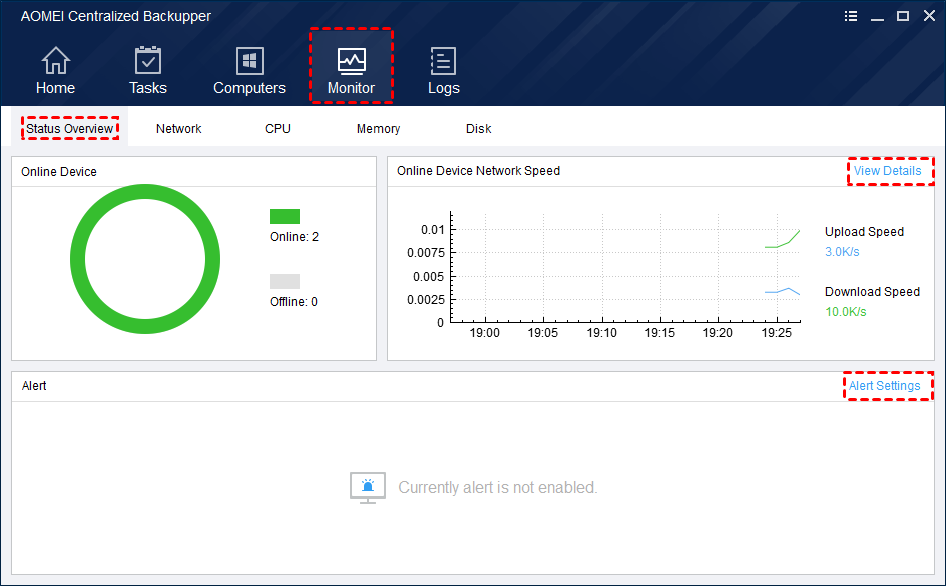
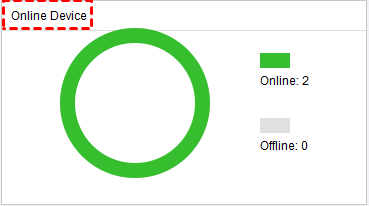
1. Online Device
Contains the numbers of currently controlled online devices and offline devices. When the mouse is moved to the statistical graph, the specific number of devices and the ratio information will be displayed.
2. Online Device Network Speed
The graph shows the network speed trend of all controlled online devices in the last half an hour, and the right side of the graph shows the total upload speed and total download speed of the currently controlled online devices.
When the mouse is moved to the graph curve, it will display the number of online devices at the corresponding time, as well as the corresponding time, the total upload speed, and total download speed of all online devices.

Click "View Details" in the upper right corner of the function interface to jump to the network page, where you can view the current network status of all controlled computers.
3. Alert
In this page, it displays the currently abnormal computers and all their performance data. Abnormal data will be marked in red.
Move the mouse to the column and display the "Status Details" button. Click the button to jump to the client's abnormal performance details page, where you can view the client's alert performance details.
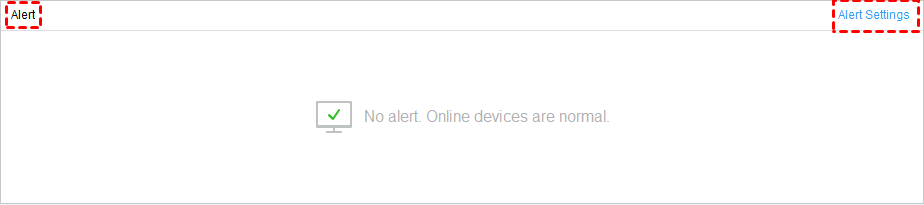
Click the "Alarm Settings" button in the upper right corner of the function interface to jump to the settings page, where you can set whether to enable the alert and the alert value of the specific alert.
In the "Alert Settings" page, you can set a value for the corresponding alert. When the value is exceeded, you will receive an alert and an alert log will be generated.

Network
Click the "Monitor" tab and click the "Network" tab to switch to the network page. You can view the current network conditions of all controlled computers. There are filter sort and search buttons in the upper left corner of the interface, making it possible to sort in different orders.
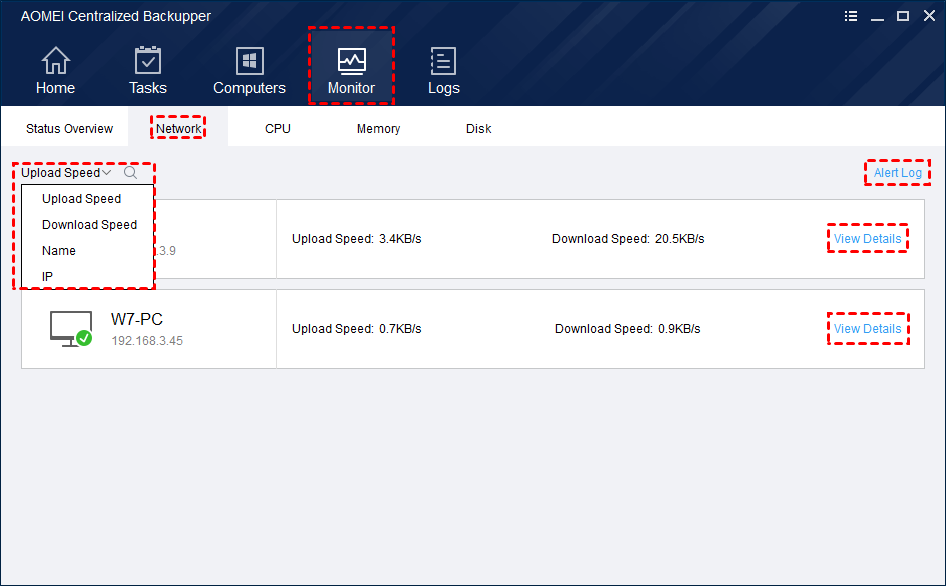
Click the "Alert Log" button in the upper right corner of the interface to jump to the Alert Log interface, displaying all alert records.
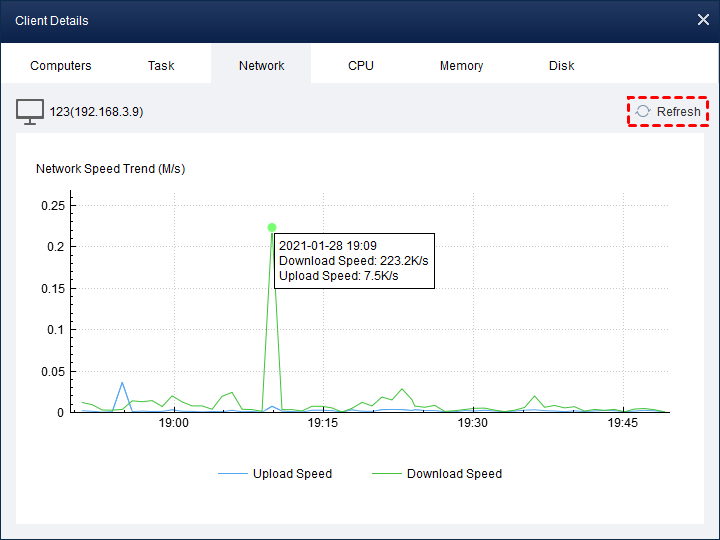
Click "View Details" on the right side of the computer list to jump to the network details page of the corresponding computer. You can view the network trend of the last hour, and click “Refresh” to display the latest trend.
CPU
Click the "Monitor" tab and click the "CPU" tab to switch to the CPU page. You can view the current CPU status of all controlled computers.
There are filter sort buttons and search buttons in the upper left corner of the interface, making it possible to sort in different orders.

Click the "Alert Log" button in the upper right corner of the interface to jump to the Alert Log interface, displaying all alert records.
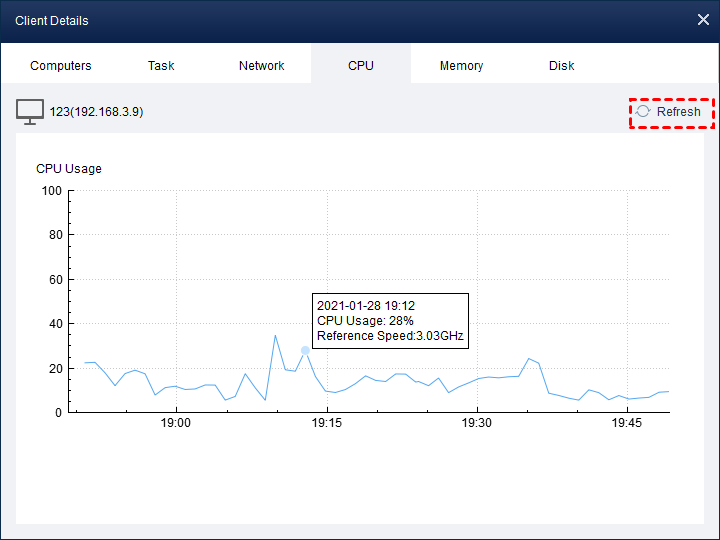
Click "View Details" on the right side of the computer list, and you will be redirected to the CPU details page of the corresponding computer. You can view the CPU usage trend of the last hour, and click “Refresh” to display the latest trend.
Memory
Click the "Monitor" tab and click the "Memory" tab to switch to the memory page. You can view the current memory status of all controlled computers.
There are filter sort buttons and search buttons in the upper left corner of the interface, making it possible to sort in different orders.

Click the "Alert Log" button in the upper right corner of the interface to jump to the Alert Log interface, displaying all alert records.
Click "View Details" on the right side of the computer list to jump to the memory details page of the corresponding computer. You can view the memory usage trend of the last hour, and click “Refresh” to display the latest trend.

Disk
Click the "Monitor" tab and click the "Disk" tab to switch to the disk page. You can view the current disk conditions of all controlled computers.
There are filter sort buttons and search buttons in the upper left corner of the interface, making it possible to sort in different orders.

Click the "Alert Log" button in the upper right corner of the interface to jump to the Alert Log interface, displaying all alert records.
Click "View Details" on the right side of the computer list to jump the disk details page of the corresponding computer. You can view the computer's disk and partition information, and click “Refresh” to display the latest information.
